webtrail Brian · My field notebook for trails and the web
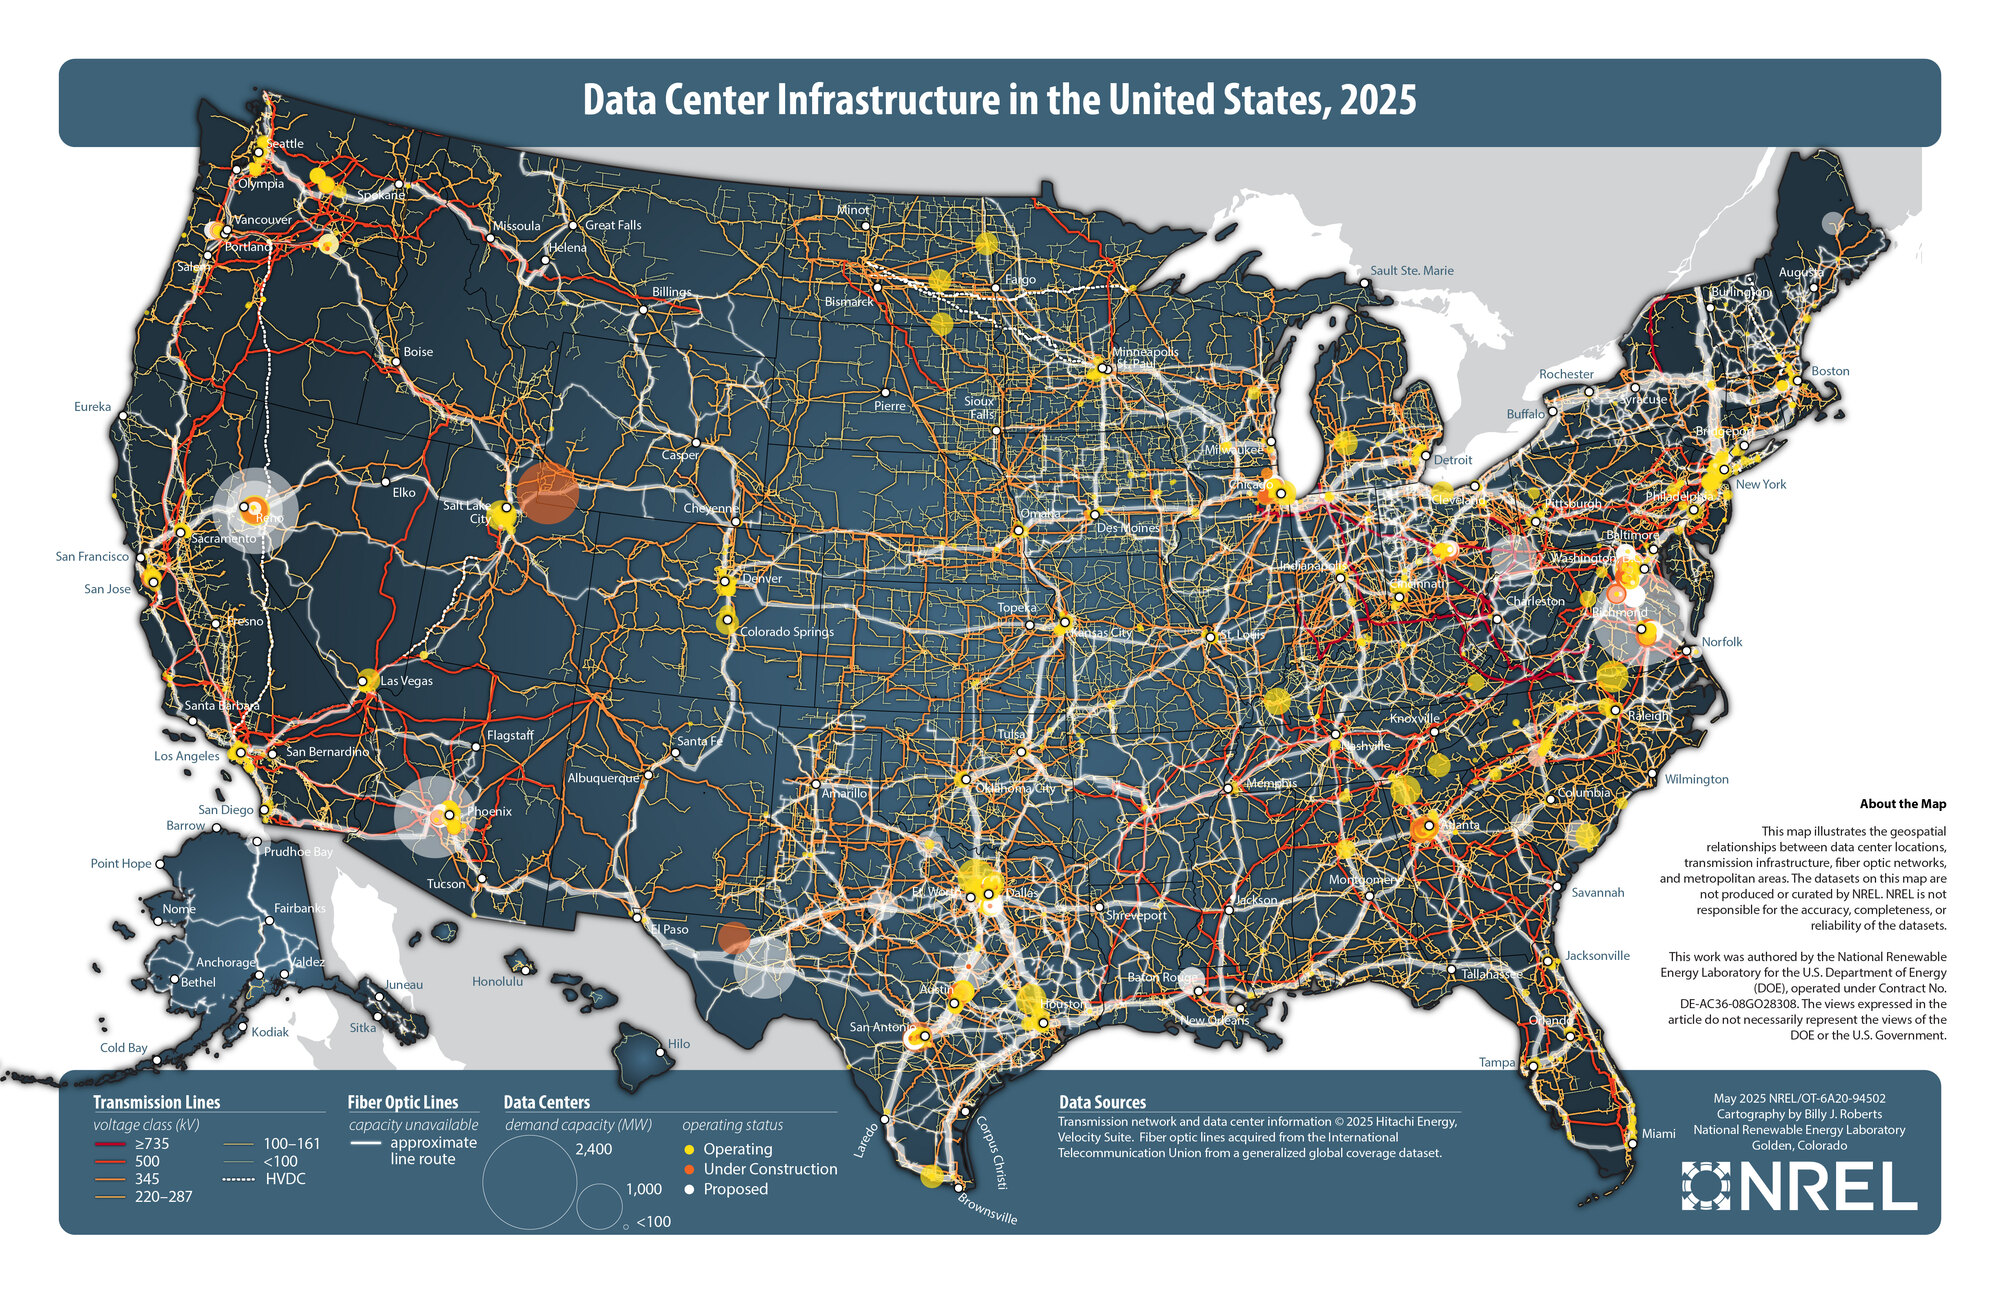
NREL map titled "Data Center Infrastructure in the United States, 2025", showing US data center locations as yellow, orange and white circles sized by demand capacity in megawatts over the electric transmission and fiber optic networks, with dense clusters around northern Virginia, Dallas, Phoenix and Atlanta.
6 September 2026 · 8 stops

AI Data Centers: What the Numbers Say, and Who Made Them

Hyperscale operators ran more than a thousand large data centers at the end of 2024, and the count keeps climbing. AI data centers are the reason the curve bent upward: bigger buildings, denser racks, and an electricity appetite that US government researchers now project could reach a double-digit share of the country's power supply before 2030. The load is not spread evenly either. It clusters in a handful of places — Virginia, Oregon, Ireland — where a new campus lands on a grid nobody built for it, and where legislators are already arguing over what it does to an ordinary household's monthly bill.

Then comes the harder half. Almost every figure in that paragraph was produced by a different method: a market research firm's proprietary tracking, a national laboratory's scenario model, a preprint nobody has reviewed, a chip maker auditing its own hardware. Those numbers are not interchangeable, and some were published by organisations with a stake in the answer. The sites gathered below are where the figures actually come from, so you can see how each one was made before you go repeating it.

This post references third-party websites for informational purposes only. webtrail does not host, own, or claim any rights over the content of the linked sites. All screenshots are used for illustrative purposes and link back to their original source.

The stops

8 sites, each opened and read
01
srgresearch.com
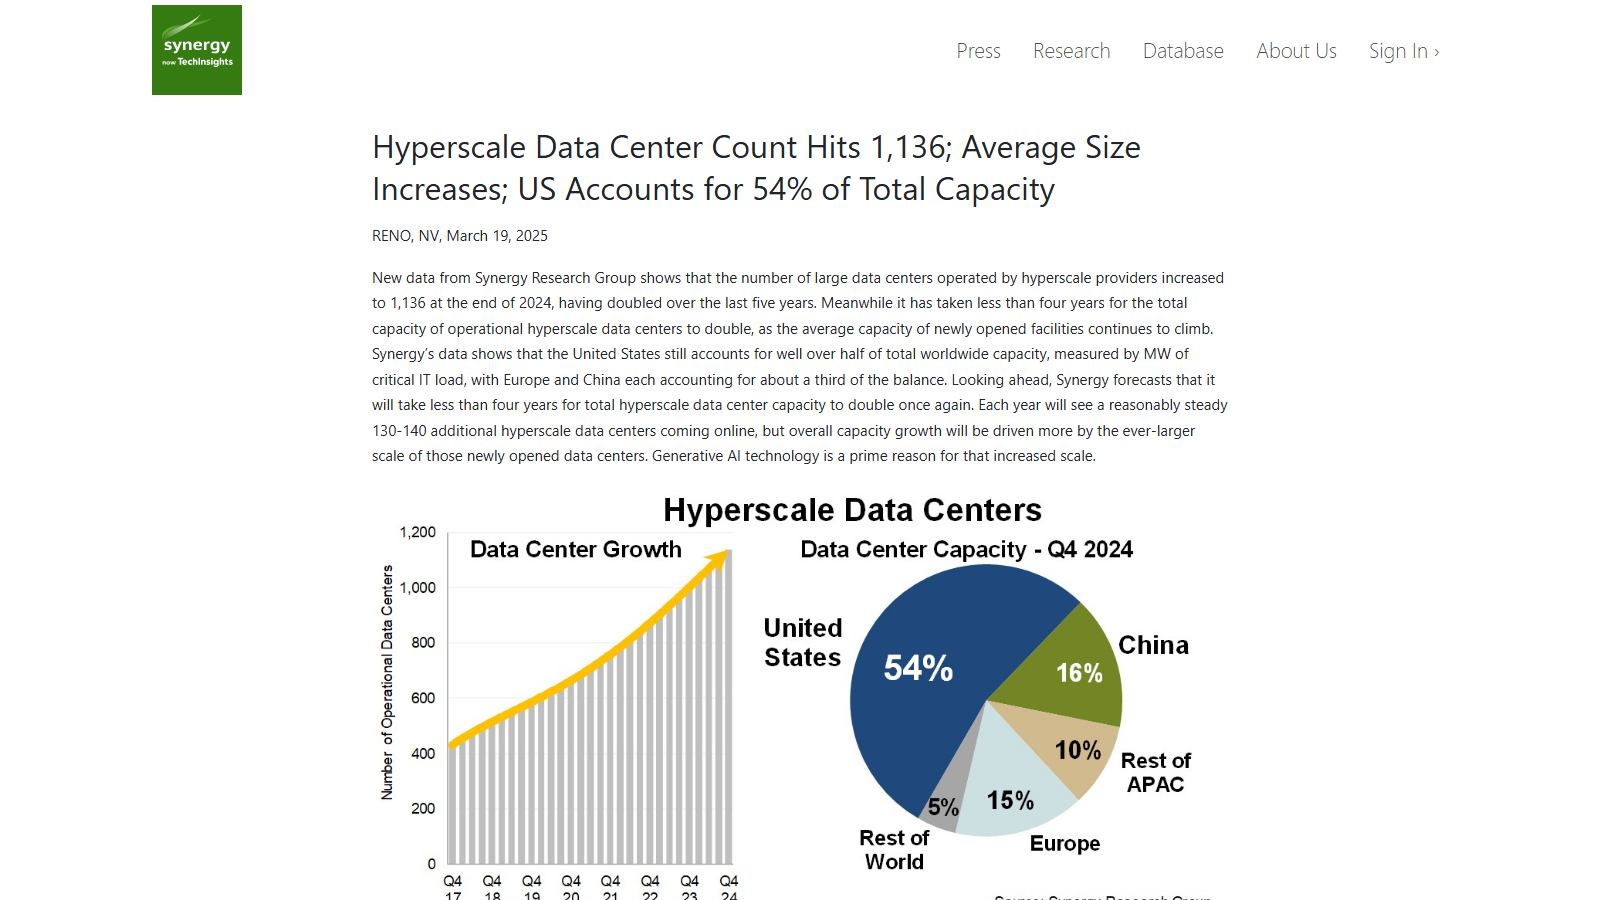
Synergy Research Group article datelined Reno, NV, March 19 2025, headlined 'Hyperscale Data Center Count Hits 1,136; Average Size Increases; US Accounts for 54% of Total Capacity,' with a bar chart of operational hyperscale data centers rising from about 430 in Q4 2017 to 1,136 in Q4 2024 under a yellow growth arrow, beside a pie chart splitting Q4 2024 capacity between the United States at 54 percent, China 16, Europe 15, rest of APAC 10 and rest of world 5

AI datacenters

Synergy Research's 2024 Hyperscale Data Center Capacity Count

data center capacity growth trends hyperscale market share

Synergy Research Group, a market research firm tracking cloud and data center markets, publishes a quarterly count of hyperscale data centers, and this March 2025 dispatch covers where that count stood at the end of 2024.

Hyperscale providers operated 1,136 large data centers at the end of 2024, double the count from five years earlier, while total capacity has taken under four years to double on its own. A bar chart tracks the count climbing from roughly 430 in Q4 2017 to 1,136 in Q4 2024, and Synergy credits the growth more to the increasing average size of new facilities than to raw numbers, naming generative AI workloads as a driver of that larger scale.

A companion pie chart splits Q4 2024 capacity by region: the United States holds 54%, China 16%, Europe 15%, the rest of Asia-Pacific 10%, and the rest of the world 5%. Synergy forecasts 130 to 140 new hyperscale facilities a year going forward, with capacity growth still driven more by scale than by count.

Every figure comes from Synergy's own proprietary dataset, tracked commercially rather than published for independent audit, so treat it as one firm's read on the market rather than an audited count. The dispatch sticks to aggregate counts and capacity share too: it says nothing about which facilities are oldest and names no individual site, so look elsewhere for data center history.
02
arxiv.org
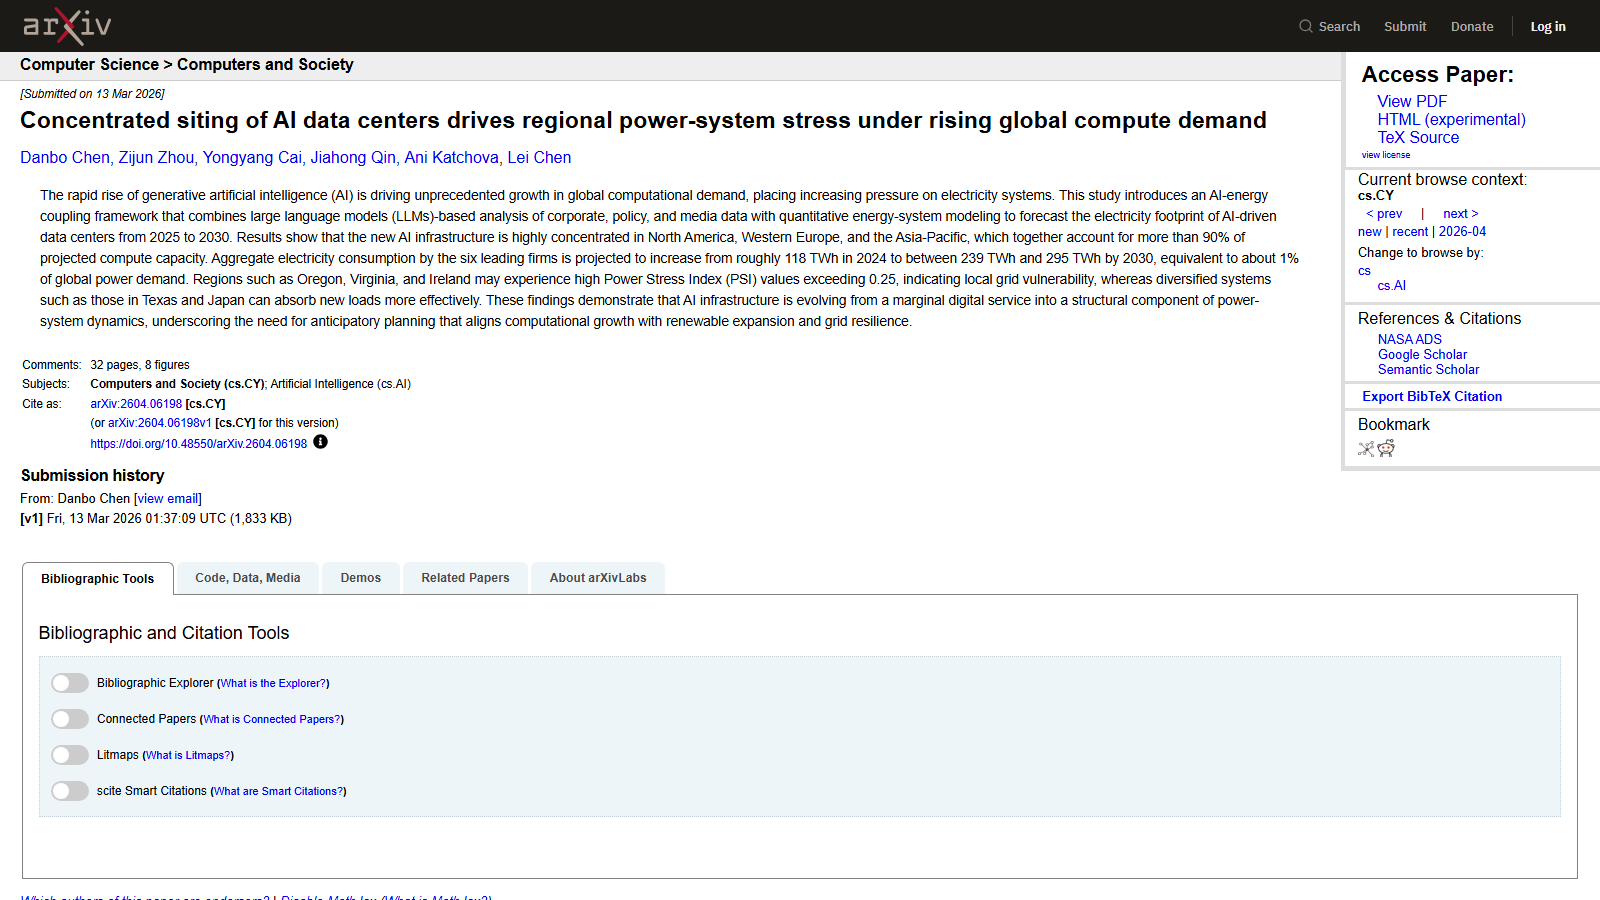
arXiv abstract page for 'Concentrated siting of AI data centers drives regional power-system stress under rising global compute demand', submitted 13 March 2026 by Danbo Chen and five co-authors, with an abstract reporting Power Stress Index values above 0.25 for Oregon, Virginia and Ireland against more absorbent grids in Texas and Japan

AI datacenters

AI Data Center Siting and Regional Power-Grid Stress, on arXiv

compute demand data center siting geographic concentration grid stress

arXiv hosts this preprint, an AI-energy coupling framework that models where AI data centers are being built and what that concentration does to the power grids beneath them. It earns catalog space for pairing corporate, policy and media data with quantitative energy-system modeling rather than repeating a single company's roadmap.

The paper's numbers run from 2025 to 2030, and it presents them as projections, not measurements. North America, Western Europe and the Asia-Pacific are modeled to hold more than 90% of new AI compute capacity, and the six leading firms' aggregate electricity use is projected to climb from roughly 118 terawatt-hours in 2024 to somewhere between 239 and 295 terawatt-hours by 2030, about 1% of global power demand. Those figures come out of a forecasting model, not a count, so treat the range as stated uncertainty rather than a settled outcome.

The more specific finding is regional. The authors define their own Power Stress Index to flag where new data-center load meets a less accommodating grid, and by that measure Oregon, Virginia and Ireland score above 0.25, while Texas and Japan absorb comparable new load more easily. The index is the paper's own construction, not an established grid-reliability standard, so its ranking is only as sound as its inputs.

The honest trade-off: this is an arXiv preprint that has not been through peer review, and the abstract page gives you the headline figures while 32 pages of methodology and 8 figures sit behind the PDF link.

03
osti.gov
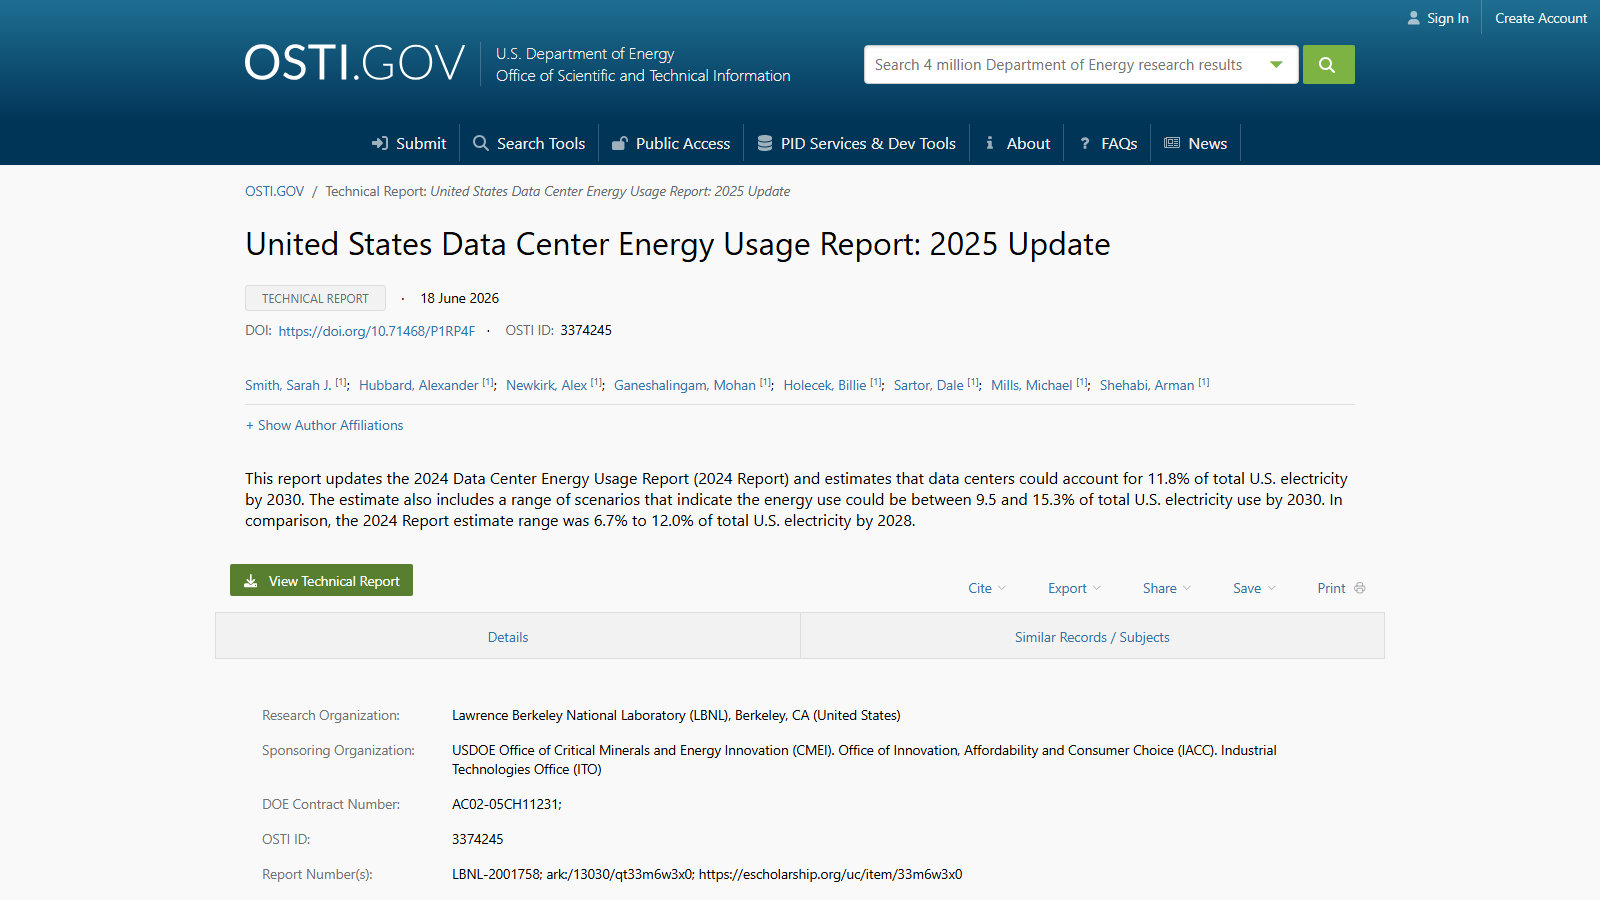
OSTI.GOV bibliographic record for the technical report 'United States Data Center Energy Usage Report: 2025 Update,' dated 18 June 2026, listing eight Lawrence Berkeley National Laboratory authors, an abstract projecting data centers at 11.8% of US electricity by 2030, a green 'View Technical Report' button, and a details table naming LBNL as research organization and three USDOE offices as sponsors

AI datacenters

Berkeley Lab's 2025 US Data Center Energy Usage Report on OSTI.GOV

data centers berkeley lab electricity demand energy consumption

OSTI.GOV is the U.S. Department of Energy's public clearinghouse for federally sponsored research, and this page catalogs the 2025 update to Lawrence Berkeley National Laboratory's data center energy usage report.

The page itself is a bibliographic record, not the report — a title, a short abstract, an author list, and a green "View Technical Report" button that links out to the full PDF elsewhere. The abstract is still worth reading on its own: it estimates data centers could draw 11.8% of total U.S. electricity by 2030, with a scenario range running from 9.5% to 15.3%. For comparison, it notes that the prior 2024 edition of the same report put the 2028 figure at 6.7% to 12.0%, which gives a sense of how quickly the projection has moved between editions.

Below the abstract, a details table names Lawrence Berkeley National Laboratory as the research organization and three DOE offices as sponsors, alongside a DOI, an OSTI ID, and eight listed authors. That is enough to cite the work or check its provenance, but there is no methodology, no charts, and no regional breakdown on this page — those live in the linked technical report, a separate download.

This record suits readers who want to verify a data center electricity statistic against its original government source, or who need clean citation details rather than a full read-through. Anyone after the underlying methodology or the supporting charts will need to follow the button through to the report itself.

04
pmc.ncbi.nlm.nih.gov
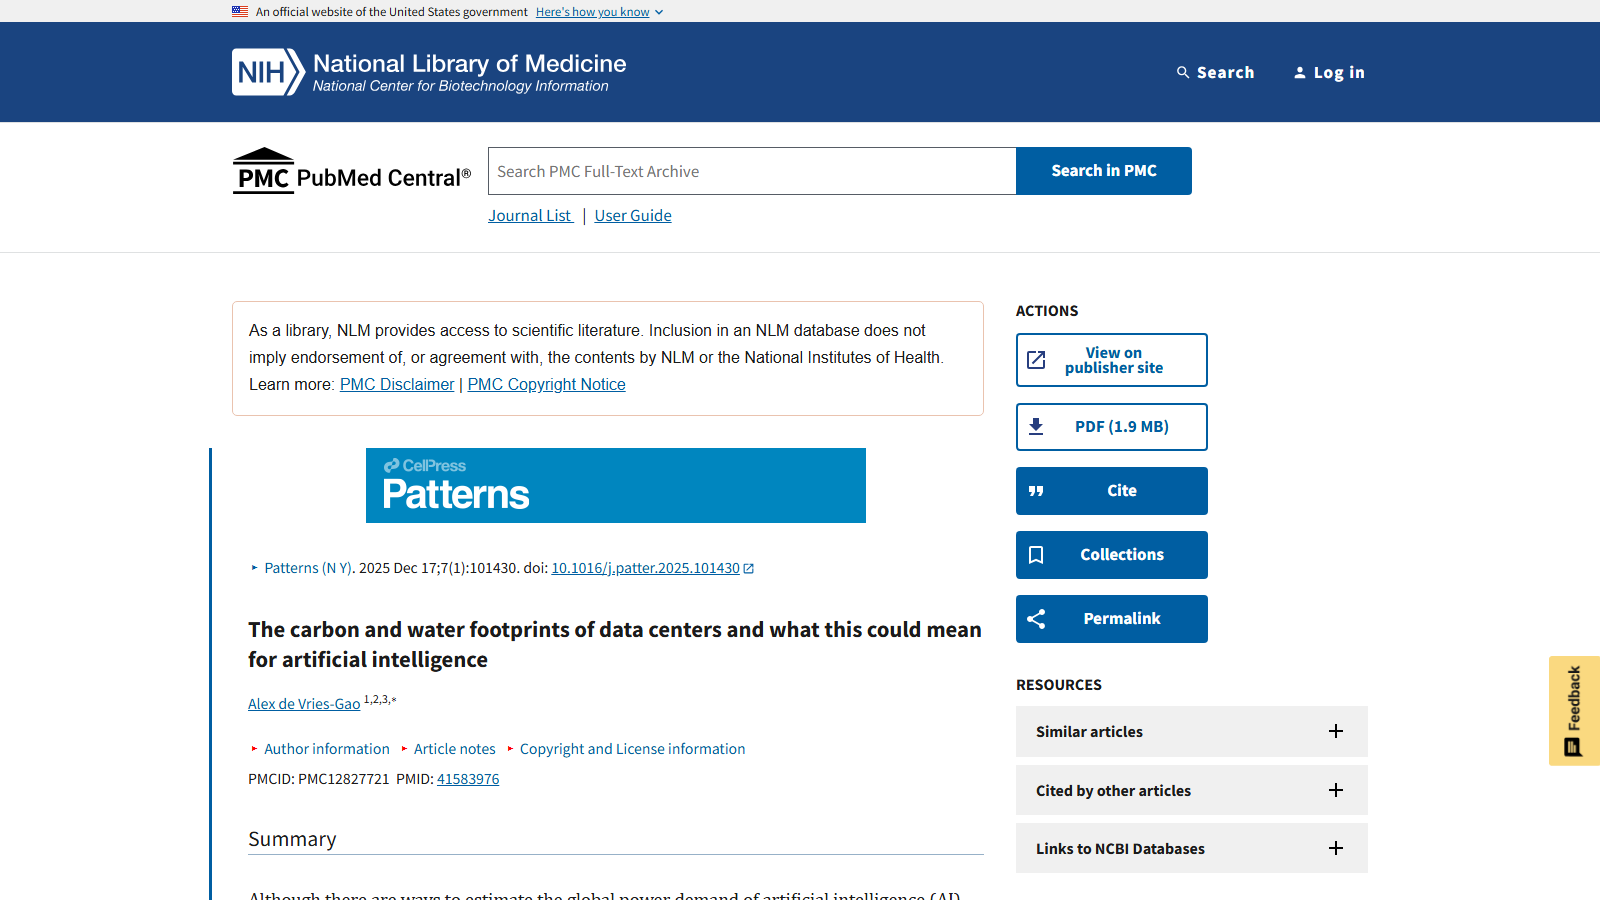
Screenshot of the PMC page for the Patterns journal article on data center carbon and water footprints by Alex de Vries-Gao, showing the NIH/NLM header, the Cell Press Patterns banner, the December 2025 citation with DOI and PMCID, the title and author byline, and a right-hand sidebar with View on publisher site, PDF, Cite, Collections and Permalink actions.

AI datacenters

A Peer-Reviewed Look at AI Data Centers' Water and Carbon Footprints

carbon footprint data centers life-cycle assessment water footprint

Patterns, a Cell Press journal, published this analysis by researcher Alex de Vries-Gao in December 2025, and PMC hosts the full text without a paywall, which is useful because most writing about AI's environmental footprint gets cited far more often than it gets actually read.

The piece starts from an admission: while there are established ways to estimate the global power demand of artificial intelligence, the carbon and water footprints of the data centers that host it are far less well characterized. De Vries-Gao works through why that gap exists. Cooling systems draw water directly, but the water and carbon embedded in the electricity a facility buys depends heavily on the local grid mix, and operators rarely publish facility-level numbers. The paper pulls together existing estimation methods and their assumptions rather than presenting new field measurements from inside a data center.

That framing matters for who should read it. This is a literature synthesis and modeling exercise from a single author, not a measurement campaign, so its figures are informed estimates with real uncertainty rather than audited facts. It suits readers who want to understand how footprint numbers for AI infrastructure get produced in the first place, including the assumptions and the gaps where estimates diverge, more than readers hunting for one headline statistic. The trade-off is density: this is a peer-reviewed research article rather than a blog explainer, and it expects some patience with methodology before it gets to a bottom line.

05
koomey.com
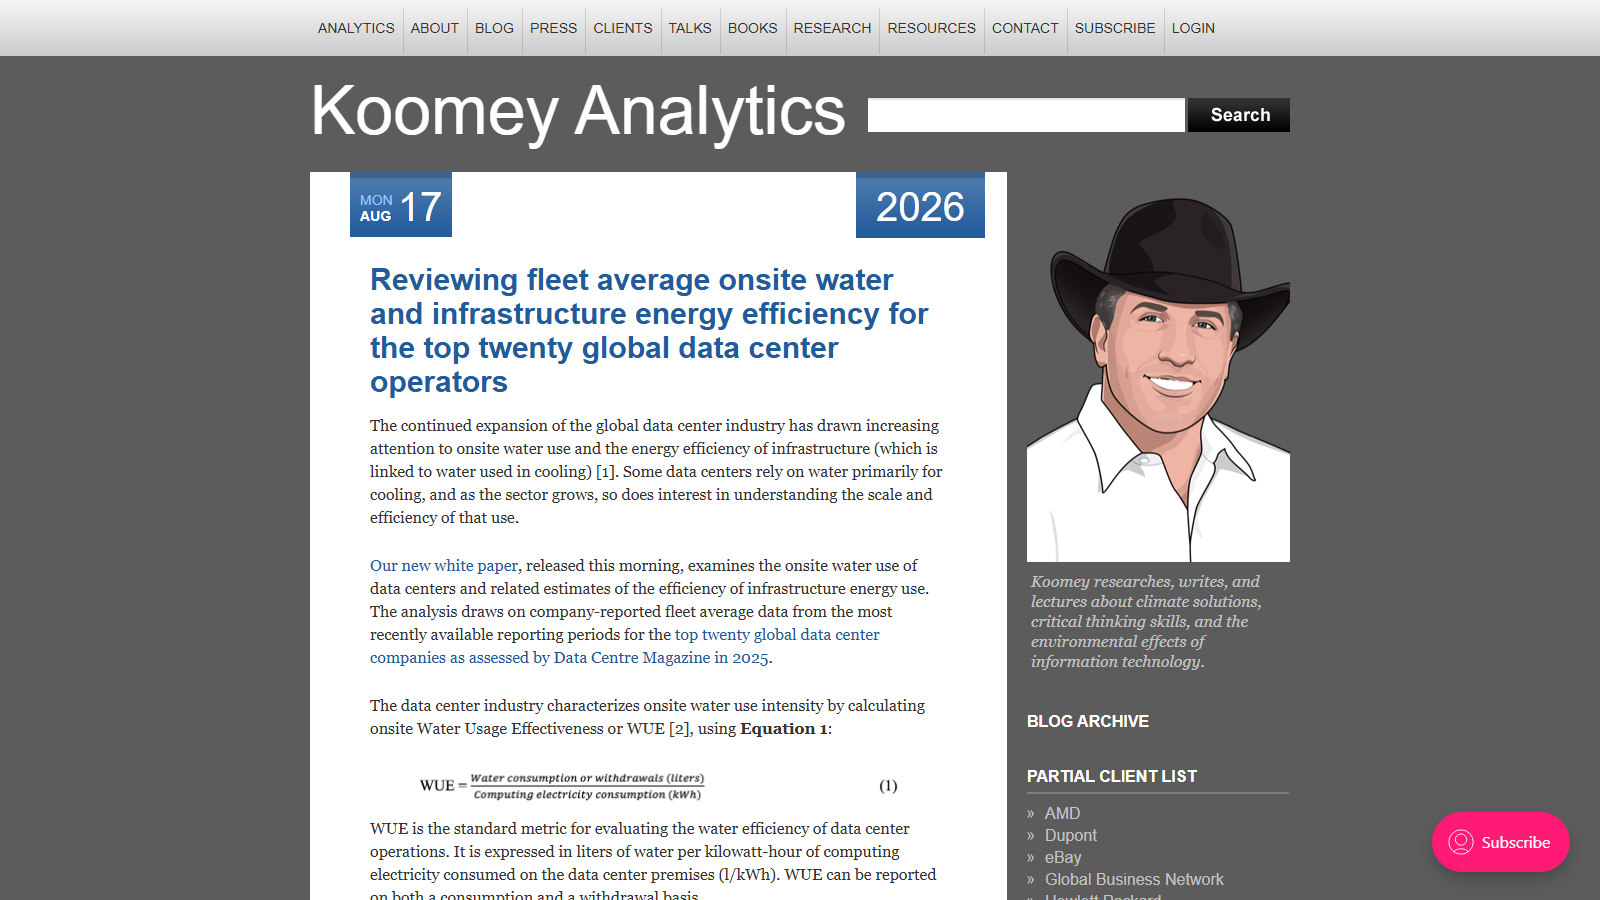
Koomey Analytics blog post dated Monday, August 17, 2026, titled Reviewing fleet average onsite water and infrastructure energy efficiency for the top twenty global data center operators, showing the opening paragraphs, the WUE equation set as water consumption or withdrawals in liters over computing electricity consumption in kWh, and a cartoon portrait of Jonathan Koomey in a black hat with a partial client list below it in the right sidebar.

AI datacenters

Koomey Analytics Previews a New Data Center Water Use Study

data center energy efficiency data center water use water usage effectiveness wue

Koomey Analytics is the site of Jonathan Koomey, an independent energy researcher who writes about data center efficiency and the environmental effects of computing; the site also lists a roster of corporate clients, which is worth knowing going in.

This particular post is an announcement rather than the study itself: it introduces a new white paper on data center onsite water use, and the operator-by-operator numbers live in that linked paper, not on this page. What the post delivers directly is a clear definition of Water Usage Effectiveness (WUE), the metric used to compare cooling water intensity across facilities. WUE is expressed as water consumption or withdrawals in liters divided by computing electricity consumption in kilowatt-hours, and Koomey notes it can be reported on either a consumption basis or a withdrawal basis — a distinction that changes what a given number actually means.

The post also names its data source: company-reported fleet-average figures for the top twenty global data center operators, ranked by Data Centre Magazine in 2025, with numbered references backing the claims rather than bare assertions. That sourcing discipline is useful on its own, even before a reader follows the link to the underlying white paper.

Come to this page for the definition and the framing around WUE, not for a ranking table of operators — that is the honest description of what you will actually find here, and it suits readers who want the metric explained before they go looking for the numbers.

06
arxiv.org
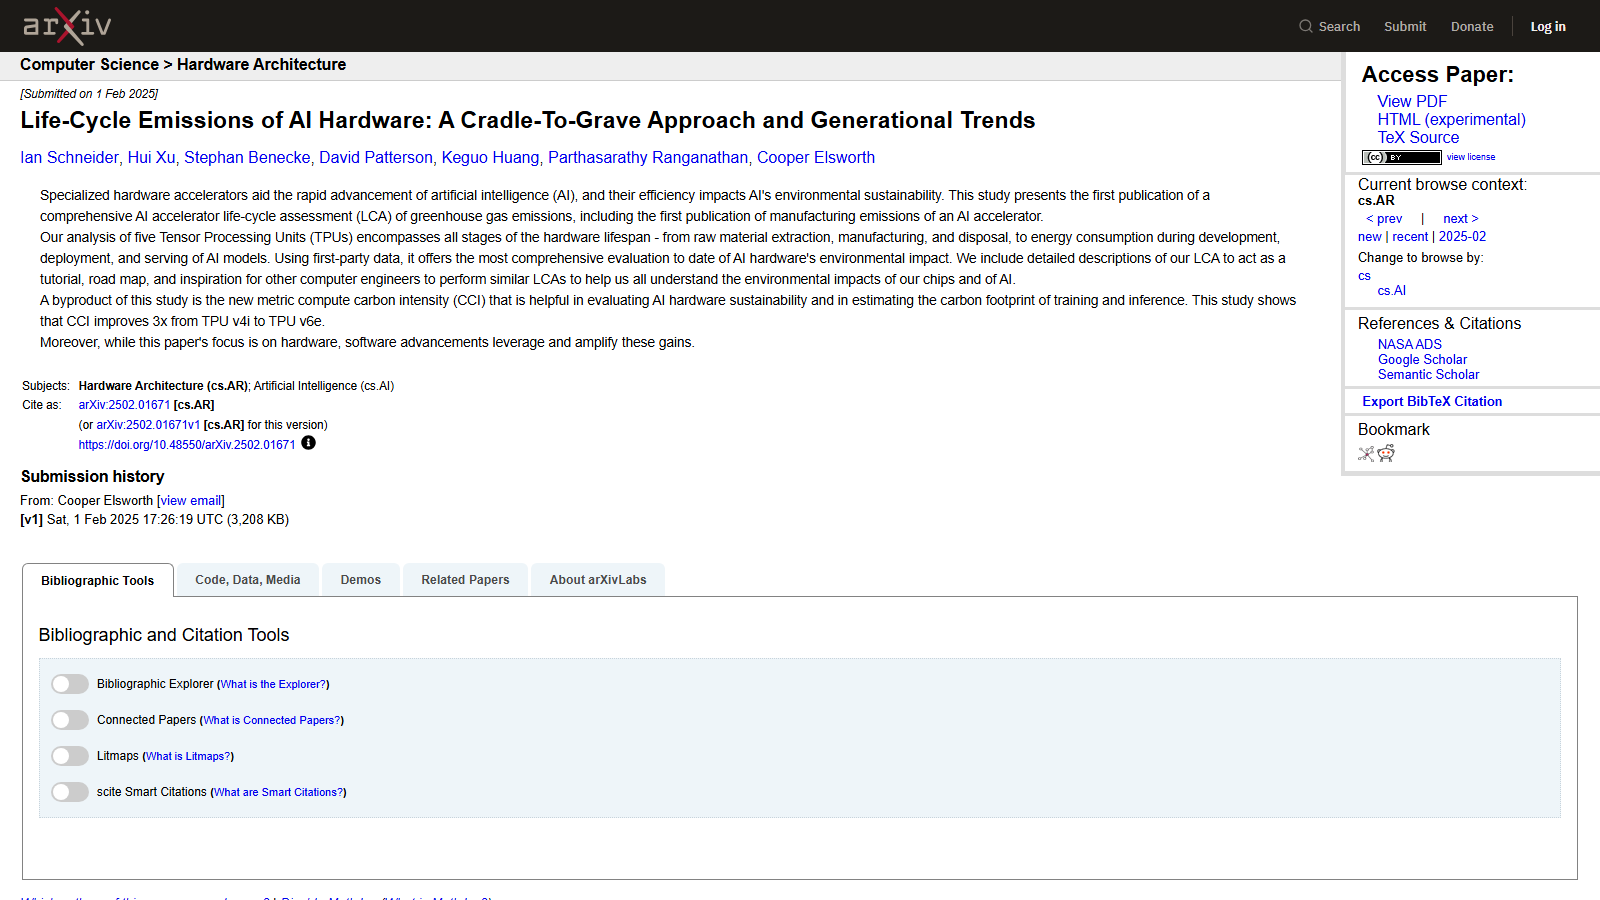
arXiv abstract page for a life-cycle emissions study of AI hardware, listing seven authors including David Patterson and Parthasarathy Ranganathan, with an abstract on manufacturing emissions of TPUs and a sidebar linking to the PDF, HTML and TeX source

AI datacenters

Cradle-to-Grave Emissions Study of Google's TPU Hardware

life-cycle assessment ai hardware embodied carbon tpu

This arXiv preprint presents what its authors call the first published cradle-to-grave life-cycle assessment of greenhouse gas emissions for an AI accelerator, covering five generations of Tensor Processing Units. It has not been through peer review. The seven authors, including well-known hardware researchers David Patterson and Parthasarathy Ranganathan, work at Google and are assessing Google's own TPU hardware using first-party manufacturing data. That dual role is exactly what makes numbers like these available at all, since chip manufacturing emissions are rarely disclosed by the companies that build the hardware, and it is also a conflict of interest worth weighing alongside the results.

The paper tracks emissions from raw material extraction and manufacturing through disposal, deliberately leaving aside the energy and water a chip draws once it is running in a datacenter. It introduces a "compute carbon intensity" metric meant to let engineers compare hardware generations on manufacturing footprint alone, and reports that this metric improves threefold between the TPU v4i and TPU v6e generations.

The appeal here is methodological transparency: the authors describe their life-cycle assessment process in enough detail to work as a rough template for engineers wanting to run a similar study on other hardware. It is a narrow slice of AI's environmental footprint, manufacturing and disposal only, drawn from a single vendor's internal figures, so treat it as one detailed data point rather than an industry-wide benchmark.

07
jlarc.virginia.gov
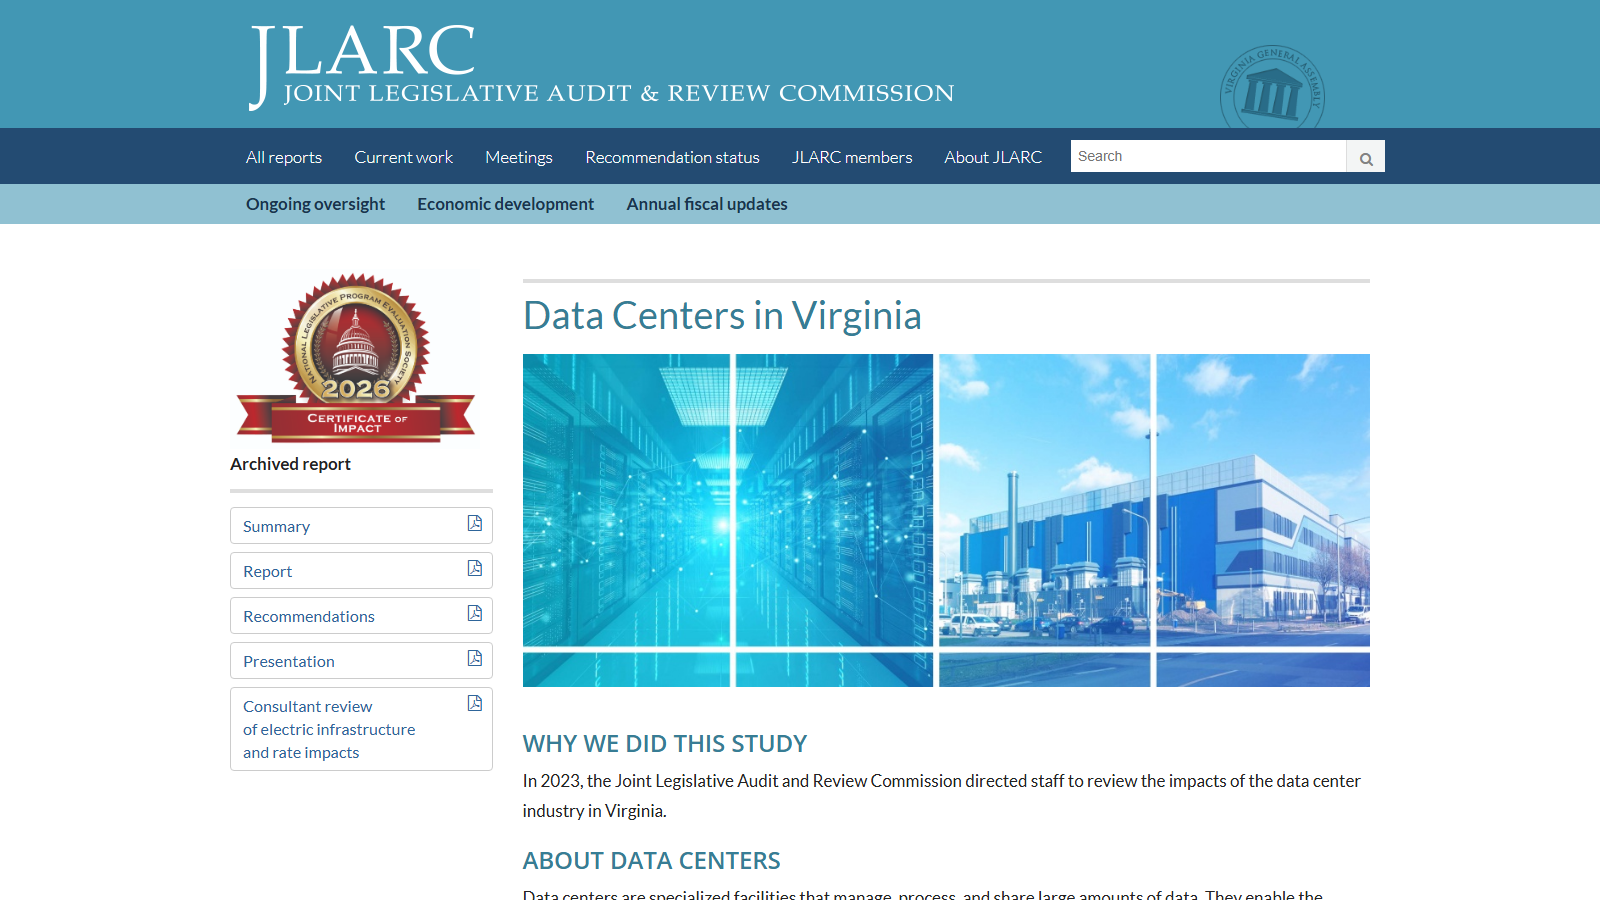
JLARC report landing page headed 'Data Centers in Virginia' beneath the Joint Legislative Audit and Review Commission masthead and Virginia General Assembly seal, labelled 'Archived report' beside a 2026 National Legislative Program Evaluation Society Certificate of Impact seal, with a four-panel banner of blue-lit server room interiors and exterior data center buildings, a sidebar of PDF links for Summary, Report, Recommendations, Presentation and a consultant review of electric infrastructure and rate impacts, and the opening 'Why we did this study' text

AI datacenters

Virginia's Legislative Study on Data Centers' Local Impact

data center siting electricity rates local impact tax incentives

JLARC — the Joint Legislative Audit and Review Commission — is the Virginia General Assembly's own oversight agency, and this page is the landing page for its study of the data center industry that has grown so heavily in the state. Lawmakers directed the review in 2023, so it answers to the legislature rather than to either side of the public argument, and it reports effects that cut both ways.

The page itself is framing, not findings. JLARC labels this an archived report and links out to five PDFs — a summary, the full report, recommendations, a presentation, and a consultant review of electric infrastructure and rate impacts — so the analysis sits behind those downloads, not in the page text.

The findings JLARC highlights run in both directions. The industry's footprint in Virginia comes out to roughly 74,000 jobs and a $9.1 billion contribution to state GDP. Against that, the study projects growing data center electricity demand could add $14 to $37 to a typical residential bill each month by 2040. The underlying work also covers siting decisions, effects on residents and natural resources, and the tax incentives the state offers the industry.

Treat the numbers as Virginia-specific. This is one state legislature auditing its own state's industry, grid and tax code, so the job counts, GDP figure and rate projections describe Virginia and won't transfer to another state or country.

08
ora.ox.ac.uk
Oxford University Research Archive record page for the journal article 'Sources of data center energy estimates: A comprehensive review', under the ORA and University of Oxford mastheads, showing the full abstract, Publication status Published and Peer review status Peer reviewed, an Actions row of Email, Share, Cite and Print, and links to the two deposited Mytton and Ashtine 2022 PDFs

AI datacenters

Sources of Data Center Energy Estimates: An Oxford Review

research methodology data provenance energy estimates literature review

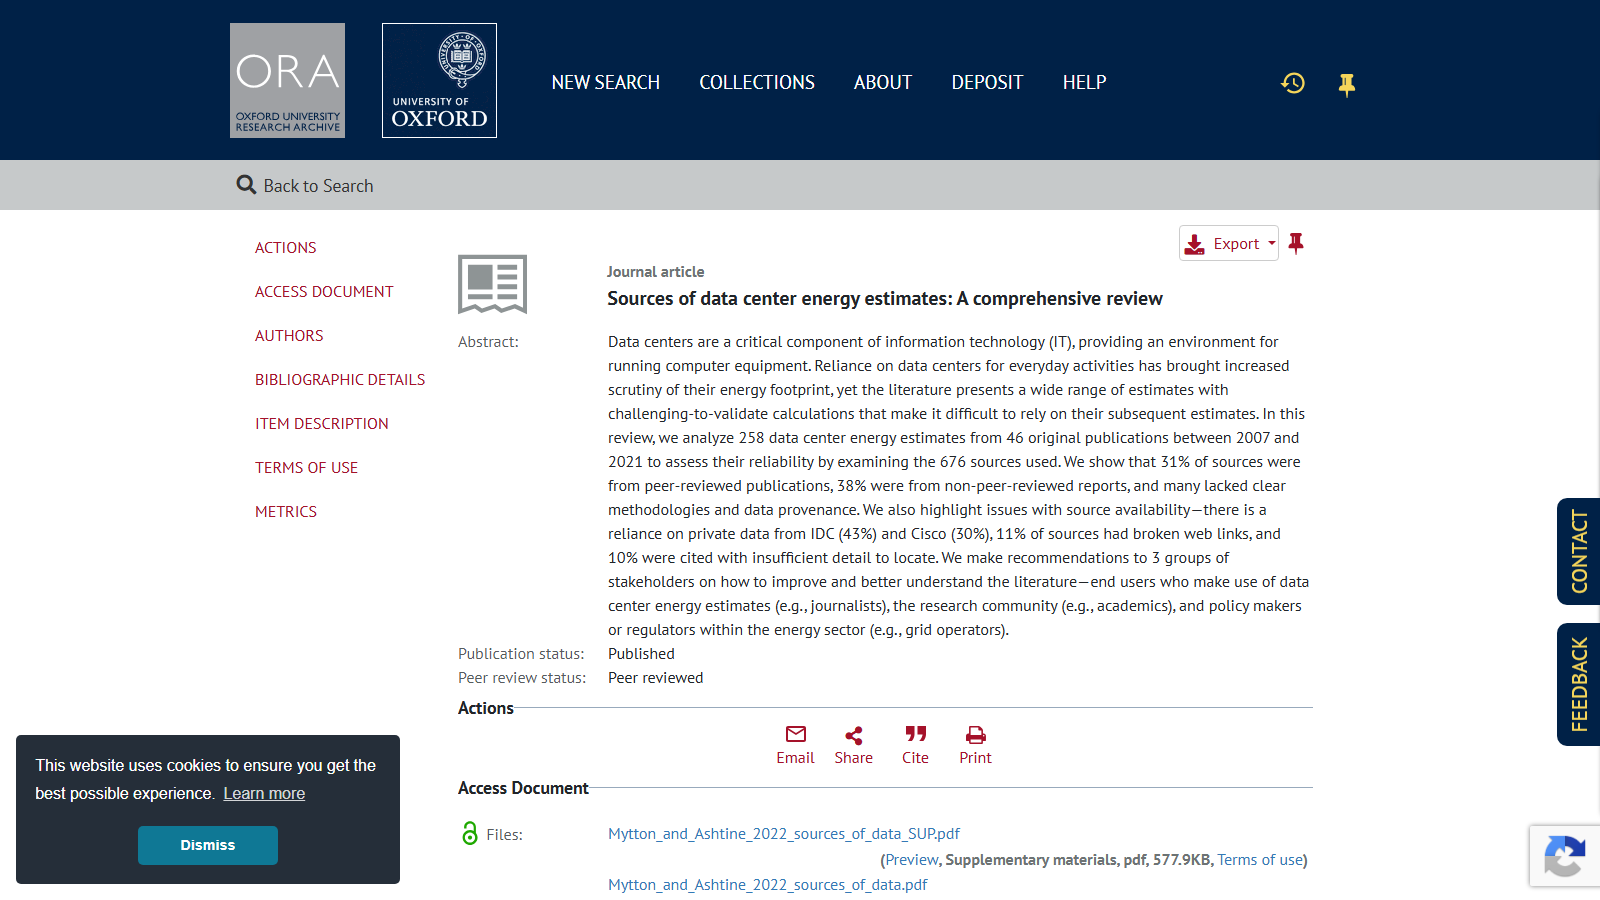
This record on the Oxford University Research Archive (ORA) holds Mytton and Ashtine’s 2022 study, which audits where the data center energy numbers researchers and journalists cite actually come from. Read it for that audit rather than for a verdict on any one figure: it reviews data center energy estimates generally, drawing on 46 publications from 2007 to 2021, and so predates today’s AI-driven buildout.

The authors trace 258 energy estimates back to the 676 sources behind them. Only 31% were peer-reviewed; 38% were non-peer-reviewed reports, and many carried no clear methodology or data provenance. The review also flags heavy reliance on private data from IDC (43% of sources) and Cisco (30%), plus practical tracing problems: 11% of sources had broken web links, and 10% were cited with too little detail to locate at all.

That makes it a useful reference for checking how reliable a data center energy claim actually is, including ones you'll meet in AI-era coverage elsewhere, since the sourcing problems it documents don't vanish just because the topic moved on. The trade-off: this is an audit of source quality, not a fresh calculation, and its own figures predate today's AI-driven demand growth.

ORA lists the article as published and peer reviewed, and the full text is open access there as two deposited PDFs: the main paper and a supplementary file.

End of trail

← All trails